Brief
Water is a necessity for everyone, but we never give much thought to how much water we drink or how we drink it.
So, use this project to study how you drink water.
The data collection
During the data collection phase, I recorded how much water I drank in the last four days, when I drank it, and how I drank it. And it is sorted and compared. This helps me analyze the data quickly.
Recorded data

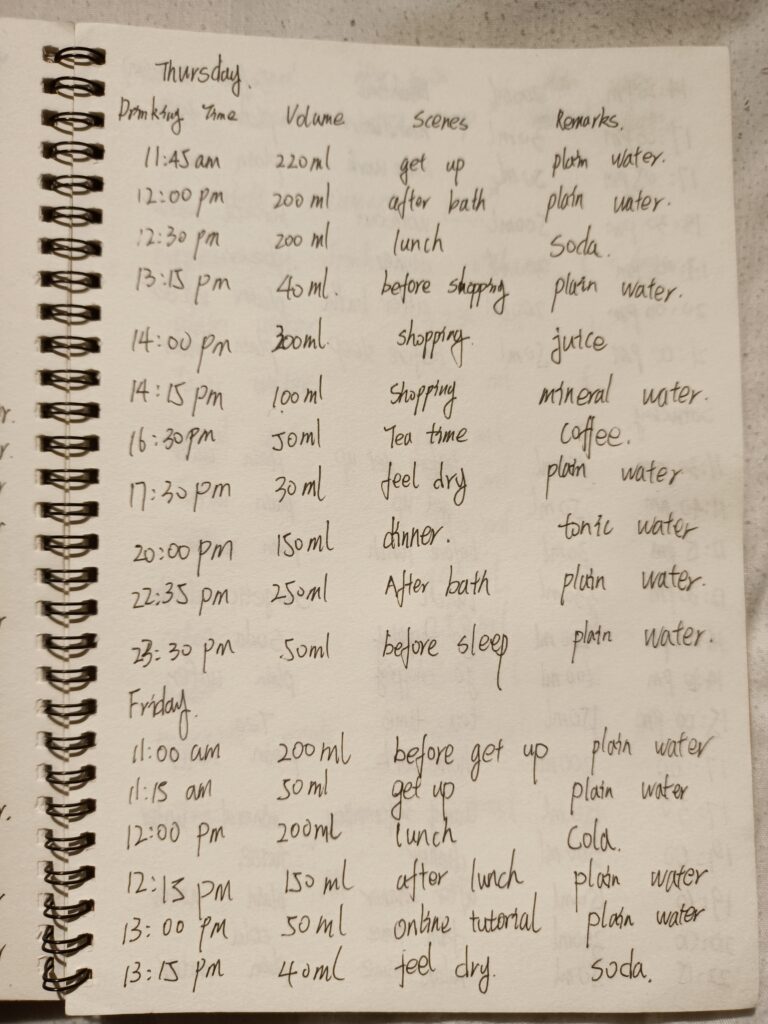

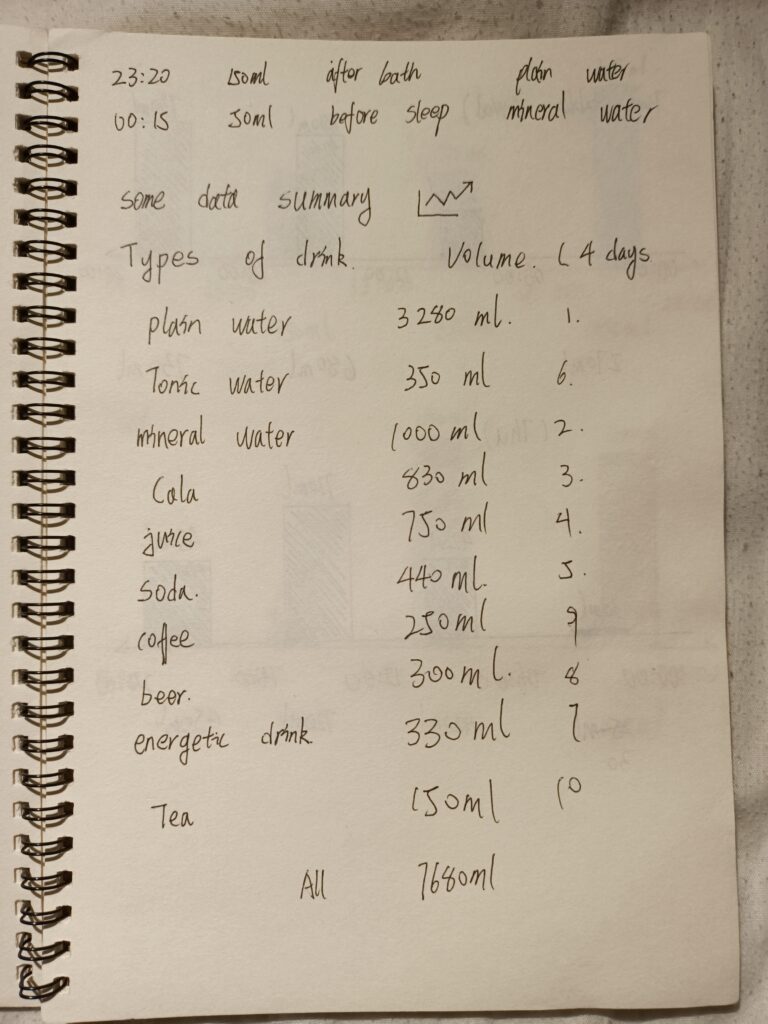
Data collection and analysis
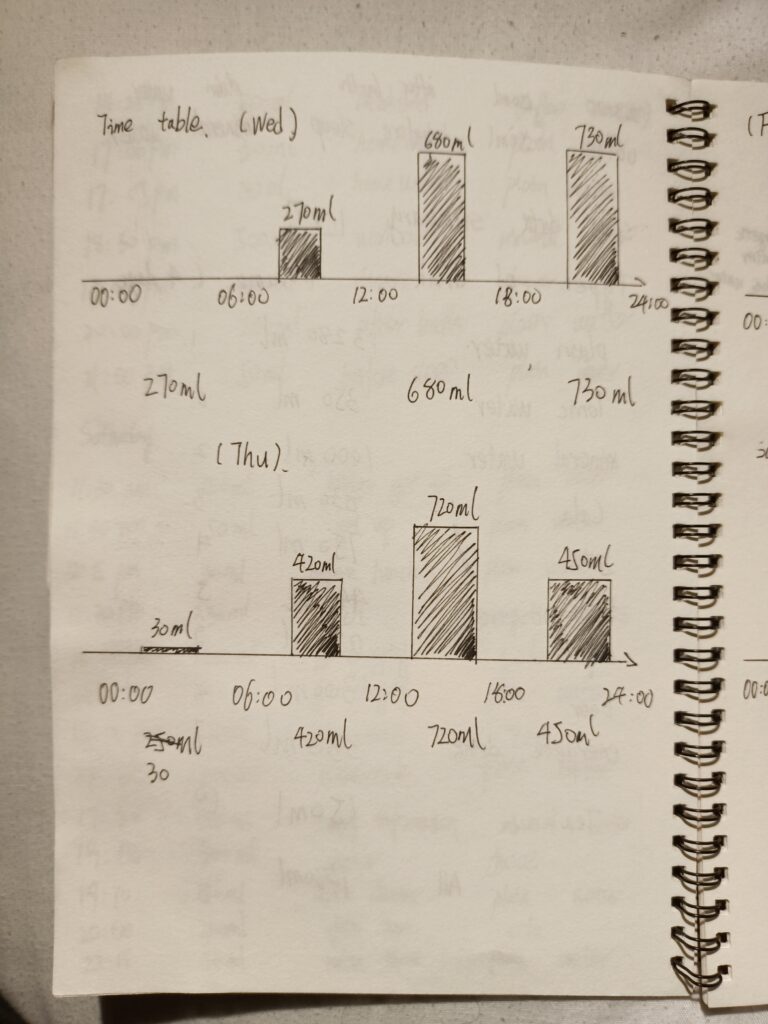
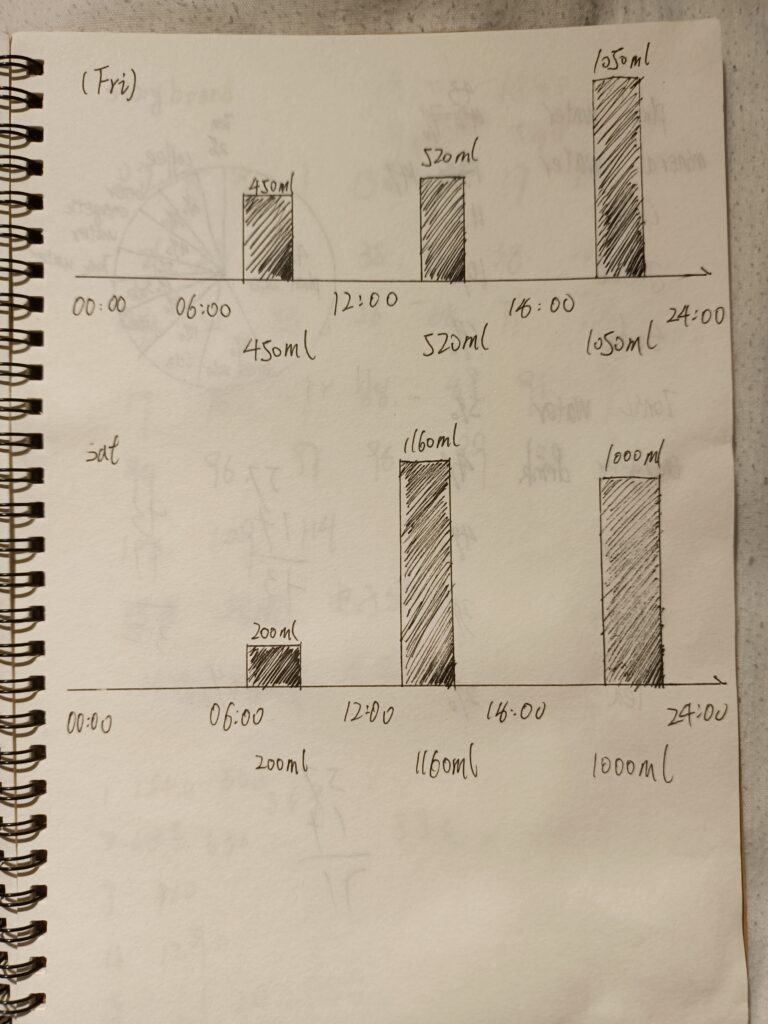
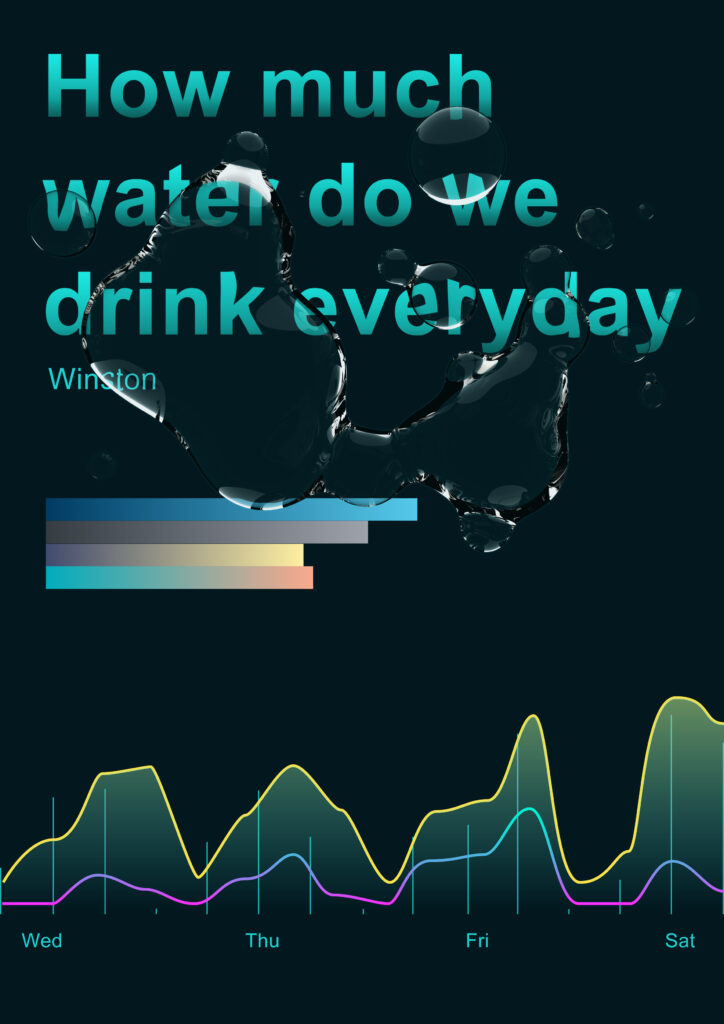
- Water consumption is mainly concentrated in the afternoon and evening, while water consumption is low in the morning.
- The proportion of drinking pure water is the highest, but the beverage content, such as cola, also accounts for a large proportion in summer.
- Drink more water after exercise and during other outdoor activities.
My project
After I have finished the statistics and analysis of the data, what I need to do now is the work of data visualization. First I will confirm the style I want to make. So I did some graphic design.
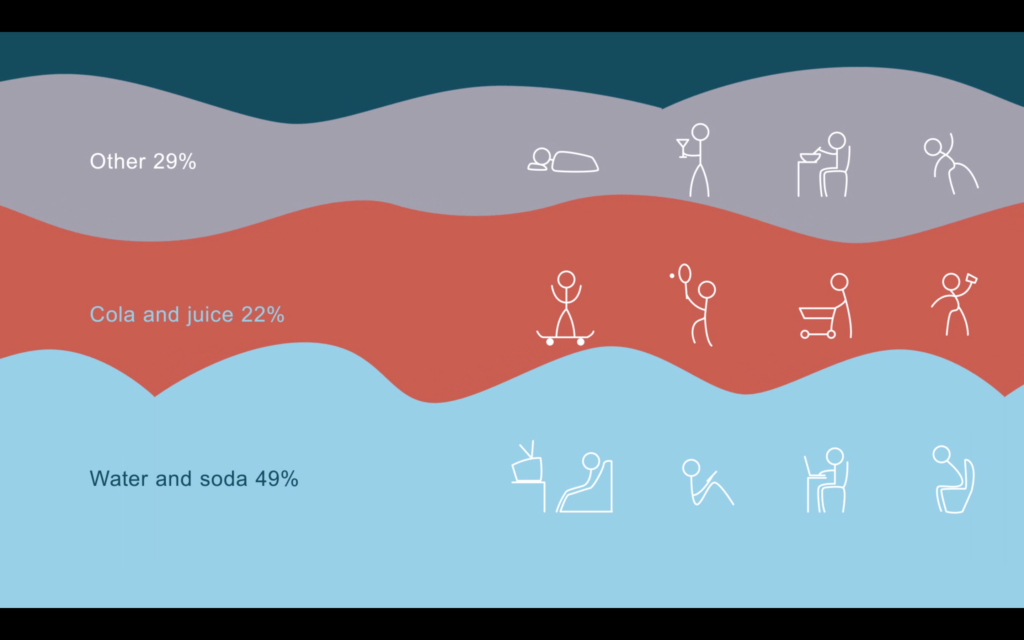

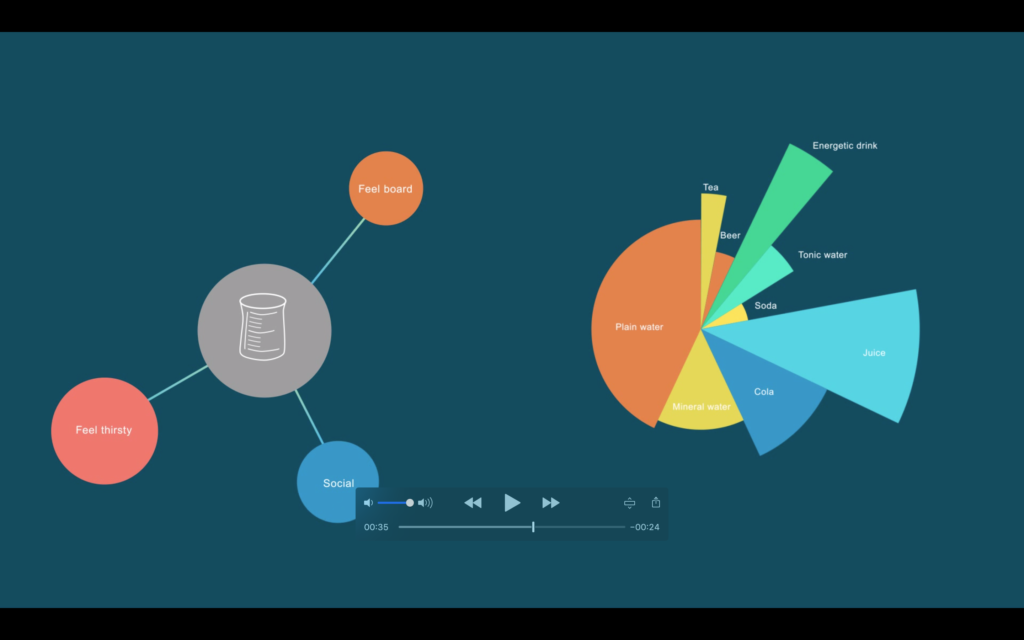
After determining my basic style and the basic information I wanted to convey, I chose to use video to demonstrate the final work I did.
Final work
Video
Poster
Reflection
This project requires us to record the data by ourselves, analyze and organize the data, draw our conclusions and conduct data visualization analysis. This project has improved our ability to organize information and visualize information. These abilities can be used to help us complete the work of information collation and expression.